Messenger Project
Introduction Link to heading
Meta (previously Facebook) saves a lot of data from their users. Thankfully, if you live in Europe, some laws force them, not to delete the data they have on you, but at least to reveal it to you.
Leveraging this knowledge, I decided to take a look at the data Facebook had on me and discovered, without surprise, that every message I ever sent was saved in carefully organized folders.
I decided to at least have a little fun with that data and see what I could do with it. I’m writing this article in 2025 but I made this project in 2022, before end-to-end encryption and merges with WhatsApp and Instagram. Some things would be completely different today. And there’s lots of different solutions like the PyPi package: messenger-counter and the website doubletext.me (among others) which seem to do the same thing (even if I haven’t tried them).
The data Link to heading
It was a big zip file containing a whole bunch of files and folders, not very well organized. Conversations were under the form of .json files and were mixed in with other image and video files. Each conversation was actually divided time-wise into several .json files which was not practical and it was necessary to concatenate them for processing.
Data cleaning Link to heading
to process the data, there was a need to clean them. I wrote the script data_cleaning.py which registered all the users who sent messages in another .json file. This cleaning also allowed to convert the date format from timestamp_ms to the clearer: Day Month, Year - Jour:Minute:Second.
In the end, the user file looks like:
[
{"name": "xxx xxx"},
{"name": "xxx xxx"},
{"name": "David Rillh"},
{"name": "xxx xxx"},
{"name": "xxx xxx"}
]
I carefully anonymized the names of my friends in respect for their (and my) privacy.
Some types of data weren’t really usable as they were, so I decided to remove them. These were mainly audio or video calls, as well as attachments like images, videos, or audio recordings, and also, surveys.
For some unknown reason, there were a lot of duplicates, messages that appeared twice. Fortunately, it was quite easy to filter them out, practically halving the size of our already very heavy pandas table.
.json files were under the following format:
[
    {
        "sender_id_INTERNAL": 0,
        "sender_name": "David Rillh",
        "content": "Quand est-ce que cette conv messenger a été créée ?",
        "type": "Generic",
        "is_unsent": false,
        "is_taken_down": false,
        "bumped_message_metadata": {
            "bumped_message": "Quand est-ce que cette conv messenger a été créée ?",
            "is_bumped": false
        },
        "datetime": "12 October, 2022 - 16:34:16"
    },
    ,,,
]
Lots of these parameters were the same across all messages and in hindsight, I don’t understand why I didn’t also filter them out. These were the following:
{
"sender_id_INTERNAL": 0,
"type": "Generic",
"is_unsent": false,
"is_taken_down": false,
"bumped_message_metadata": "<same message>",
"is_bumped": false
}
I noticed that it would have been very interesting if the is_unsent parameter could have the value “true” since that would have meant that it was possible to see a message even after it was deleted. I think I remember checking and finding that no, when you delete a message it does not appear in the downloaded data either.
Data processing Link to heading
To process the data, I used the pandas library to convert it into easily usable data tables. I also used matplotlib to plot the various results we were interested in.
To process the data efficiently, my poor developer habits led me in all sorts of directions, but luckily I remembered OOP: Object-Oriented Programming.
So I wrote a Python file in which I wrote a whole bunch of Python functions that would be the building blocks of the program. For example, there’s the simple function that counts the number of messages per person:
#This function is used to get the list of all participants
def get_participants(folder='.'):
...

#This function returns a pandas Series with the names and the total number of messages
def count_messages_per_person(df):
count = df['sender_name'].value_counts().sort_values()
count_df = pd.DataFrame({"sender_name": count.index, "message_count": count.values})
return count_df
I also needed functions to manage the graphs, which would all follow a certain template that I therefore defined by taking into account the building blocks above. For example, the graph that would display horizontal bars:
# This function is used to plot the bar chart
def print_barh(people, values, title='', percentage=False, fsize=(20, 10)):
    fig, ax = plt.subplots(figsize=fsize)
    rects = ax.barh(people, values, color='orange')
    ax.set_title(title)
    rounded_values = [round(value, 2) for value in values]
    if percentage == True:
        rounded_values = [str(value) + '%' for value in rounded_values]
    ax.bar_label(rects, rounded_values, padding=-50, color='white')
    plt.show()

# A function that plots a series of values against a series of dates
def print_line(x, y, title='', xlabel='', ylabel='', fsize=(20, 10)):
...
Then I defined a Chat class, which applies to all conversations and which has specific methods and properties using the previously defined bricks building blocks:
class Chat:
def __init__(self, folder='.'):
self.participants, self.messages = get_parti_msgs(folder)
self.count = count_messages_per_person(self.messages)
def show_count(self):
...
Graphs and interpretation Link to heading
Now that the hard work is done, let’s have some fun!
I was surprised to learn that I was the least talkative person among my group of friends:
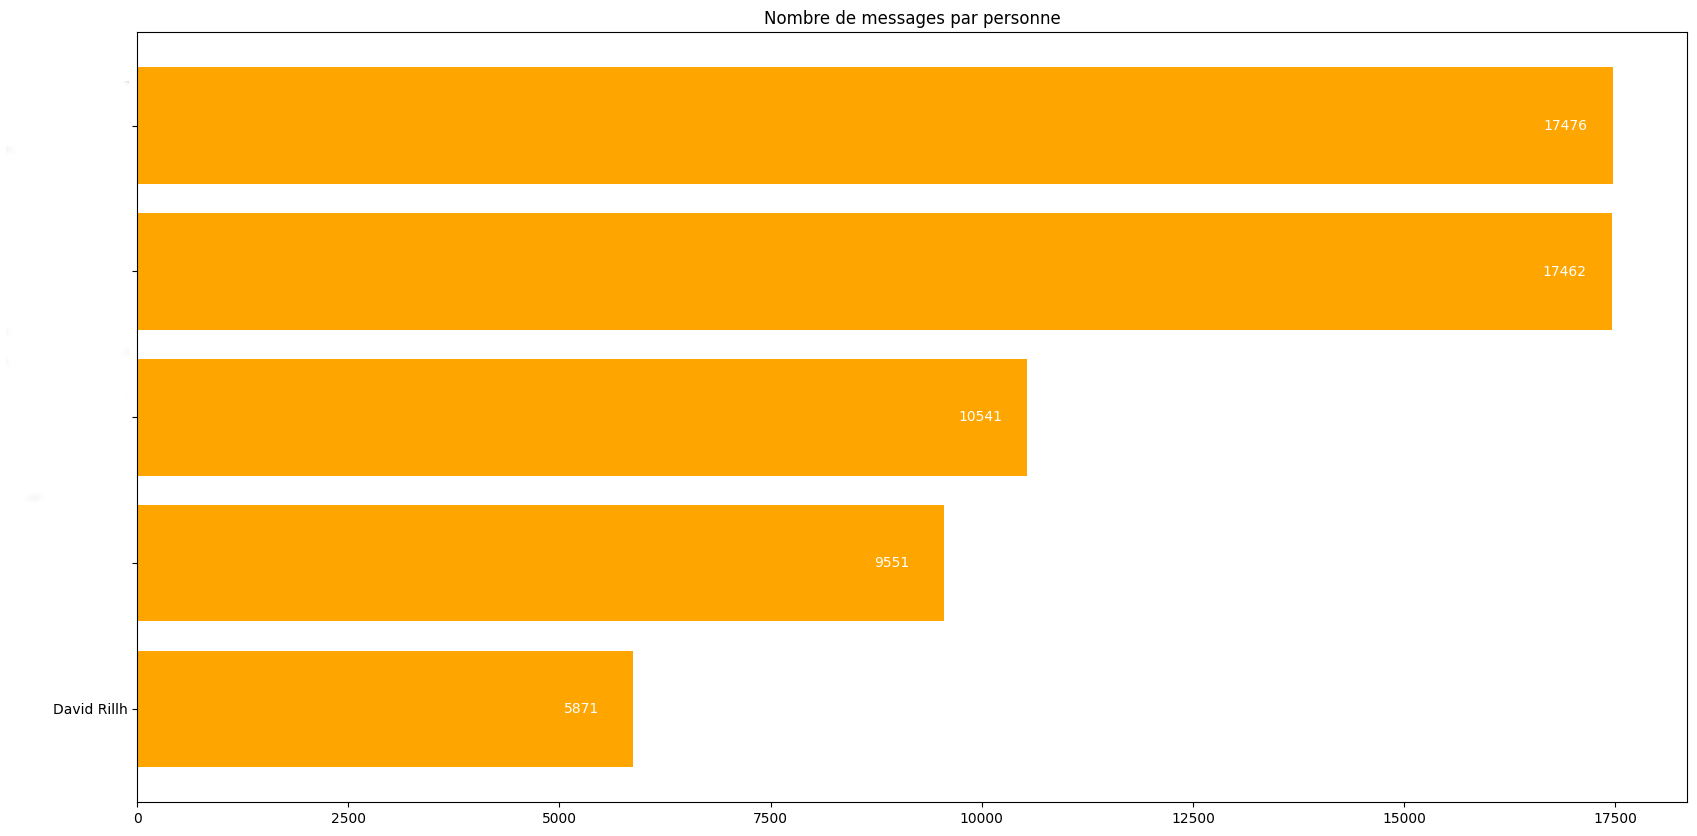
My friends’ names are erased here
There are many other metrics that can now be generated using this:
- Graph the percentage of messages containing certain words like “lol”, “why”, “hi”, specific characters like “?”, “:)”, “^^”, as well as other language tics like “mdr”, “jsp”, “pk”, etc…
(Sorry for all the english speakers reading this, the above are basically common texts and phrases for french!)
-
Graph the average number of characters per message
-
Graph the most frequently used words as shown below:
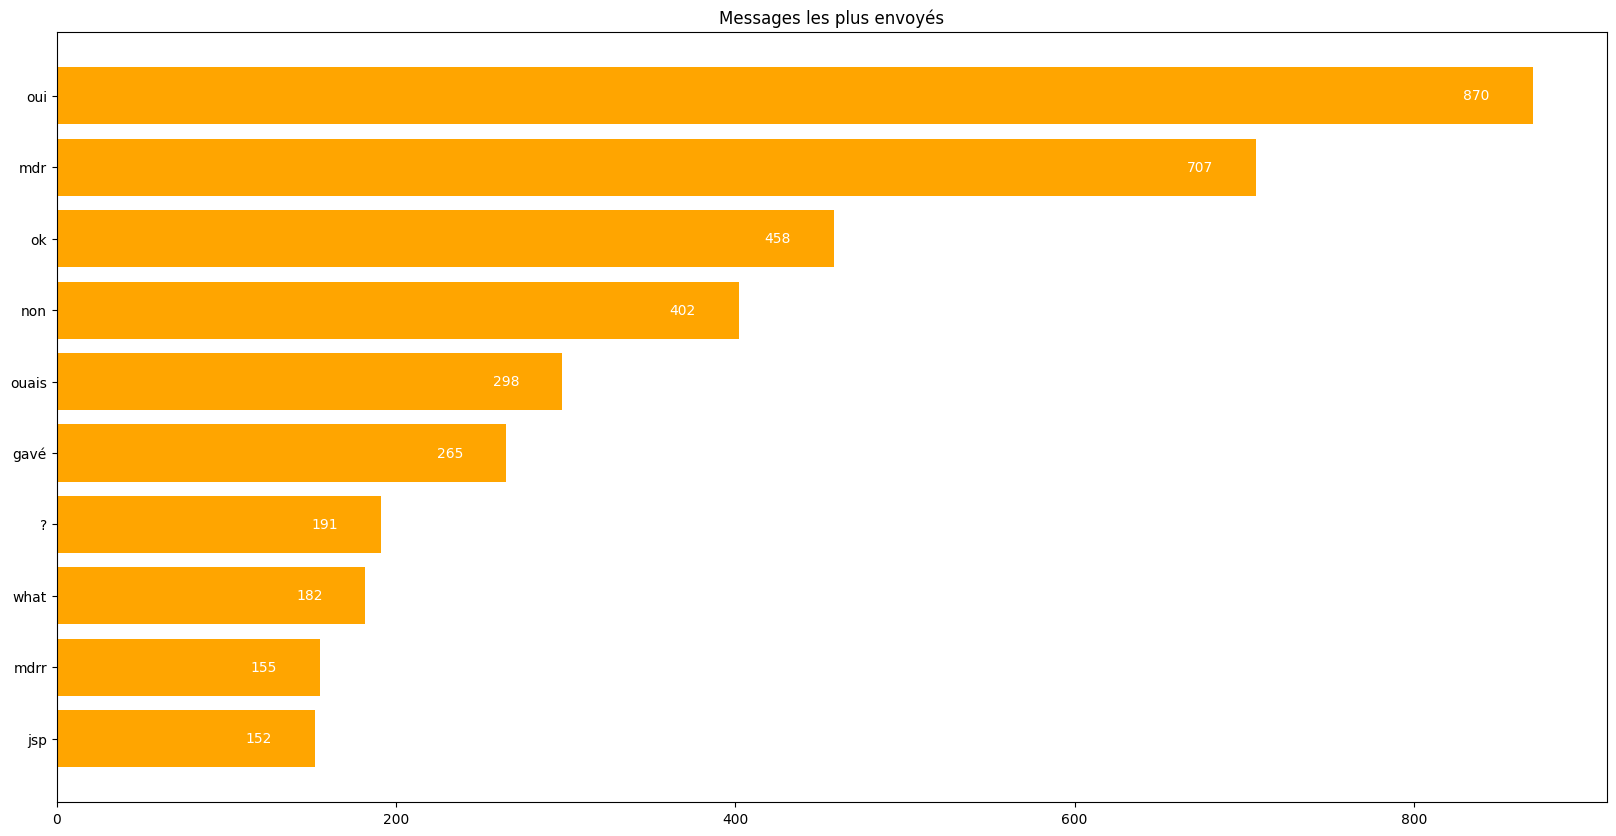
The shortest words are the most likely
-
Who used the most frequently used words?
-
Who uses the most words related to food or money, who is the most polite (using words like “please,” “sorry,” “thank you,” “you’re welcome,” etc.)
Next, it can be very interesting to see how the number of messages per day has changed over time. To do this, we count the number of messages per day, month, or year, over a given period:
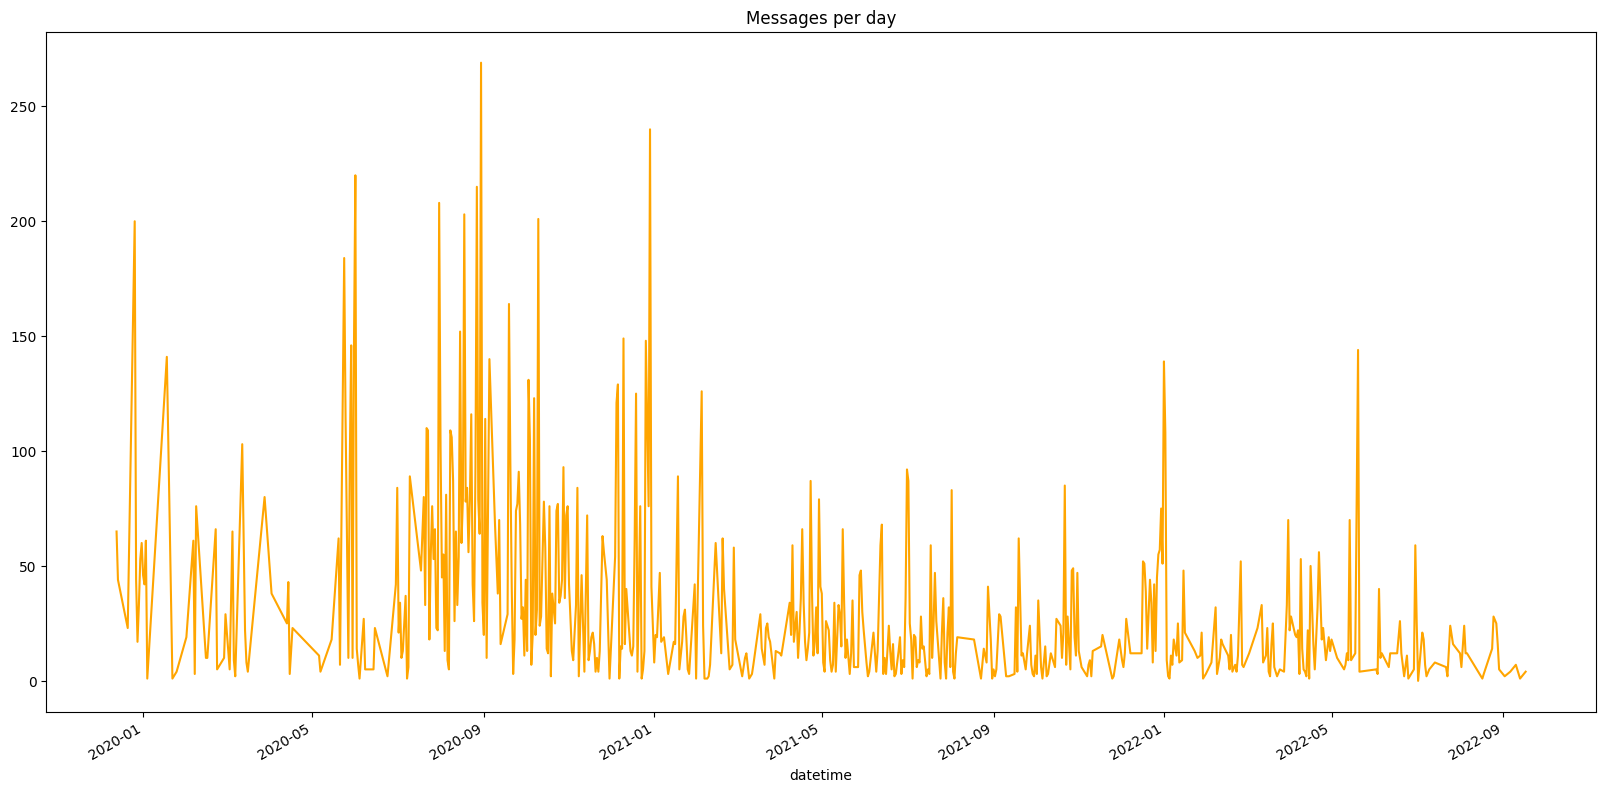
Some patterns emerge
More than 250 messages in one day? Wow, I wonder what could have happened that day!
It’s also possible to graph the number of messages per day across time for each person.
Conclusion Link to heading
Without going into too much code details For further resources, feel free to check out my GitHub repo or the resources linked in the intro.
See you soon!